The Astounding Power of Area
4.1 What we Like to Believe about Probability
[The content for this part of the course is adapted from the forthcoming MAA book: PROBABILITY: A CLEVER STUDY GUIDE.]
We intuitively believe that for many basic actions – such as flipping a coin, rolling a die, spinning a spinner – each possible outcome from the action has a certain inherent number associated with it, called its probability, and that this number manifests itself as follows:
If a certain outcome of an action has a probability \(p\%\) of occurring, then in performing that action many, many times, we’d expect to see that outcome about \(p\%\) of the time. (And the observed proportion gets closer and closer to \(p\%\) if we perform the action more and more times.)
For example, if we roll a die a million times, we feel we’ll likely see a roll of a \(6\) about one-sixth of the time. If we toss a coin a \(90,000\) times, we feel we’ll see about \(45,000\) of the tosses land heads. And so on.
We also feel that this vague intuitive idea works in reverse. For example, if we toss a coin \(500\) times and it lands heads for a count of \(403\) of those \(500\) tosses, then we’ll all strongly suspect that the coin is biased (and biased with a probability of about \(80\%\) for tossing a head).
Even with just this vague understanding of matters, without a clear definition of probability in hand, we can nut our way through some challenging probability problems just by imagining repeating an experiment a large number times.
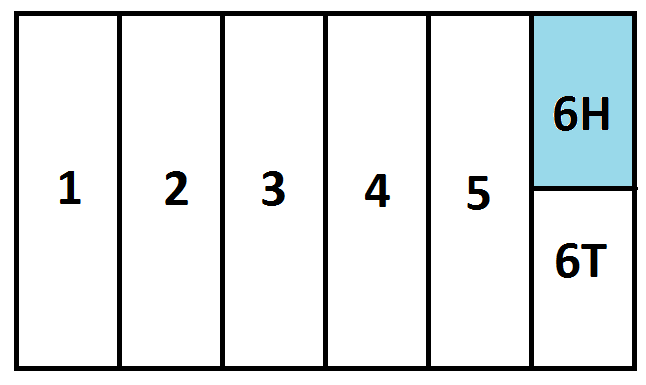
A Typical Example: Imagine rolling a die and tossing a coin. What are the chances of seeing a \(6\) followed by a HEAD?
Answer: Do imagine running this double experiment a large number times, say, \(600\) times. (That is, roll a die and then toss a coin and record the results as a pair six hundred times.) We would expect to see a roll of a \(6\) about \(100\) times, and of those, close to half would be followed by a toss of a HEAD and half the toss of a TAIL. That is, we’d expect to see a \(6\) followed by a HEAD about \(50\) times. This is \(\dfrac{50}{600}=\dfrac{1}{12}\) of the time.
Thus we conclude: \(P\left(6 \; and\; HEAD\right) = \dfrac{1}{12}\).
Alternatively, rather than work with specific numbers, draw a rectangle to represent a large number of runs of the experiment. Each possible roll of the die is represented as \(\frac{1}{6}\) of the rectangle. The portion corresponding to rolling a \(6\) is further divided into portions that match the balance of coin-toss outcomes. We see that the specific outcome of \(6\) followed by HEADS occurs \(\dfrac{1}{12}\) of the time.
A More Complex Example: A bag contains \(8\) Tuscan sunset orange balls and \(2\) Tahitian sunrise orange balls. The color difference is very subtle and only \(70\%\) of people can correctly identify the color of a ball when handed one. Lulu pulls a ball out of the bag at random and tells you over the phone that she pulled out a Tahitian sunrise ball. What are the chances that the ball she holds in her hand really is Tahitian sunrise?
Answer: Let’s assume, as the statistic given suggests, that there is a \(70\%\) chance that Lulu can correctly identify the color of a ball when handed one.
Now imagine Lulu conducting this ball-picking experiment a large number of times, say \(100\) times (and that her chance of correctly identifying colors does not change.)
About \(80\) of the balls Lulu pulls out will be Tuscan sunset. Of those, she’ll identify about \(0.7\times 80 =56\) of them correctly as Tuscan sunset and \(24\) she’ll incorrectly say are Tahitian sunrise.
About \(20\) of the balls Lulu pulls out will be Tahitian sunrise, of which she’ll correctly identify \(0.7 \times 20 = 14\) as such. However, she’ll incorrectly call \(6\) of them Tuscan sunset.
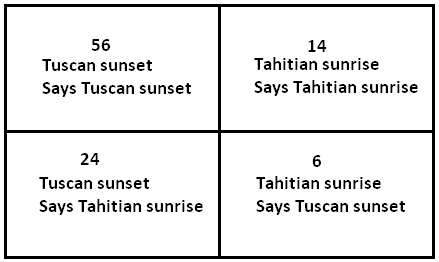
Thus in these \(100\) runs of the experiment we see that Lulu will say “Tahitian sunrise” about \(24+14=38\) times and will be correct in saying this \(14\) of those times. This shows that the probability of her ball really being Tahitian sunrise is
\(\dfrac{14}{38} \approx 37\%\),
pretty low!
EXERCISE: Suppose that one-percent of the population has a certain disease. A test for the disease will return a positive result for \(99\%\) of the people with the disease and give a false negative for \(1\%\) of those with the disease. The test will correctly give a negative result for \(95\%\) of those people without the disease and otherwise gives a false positive.
You have just tested positive for the disease. Show that there is a one-in-six chance that you actually have the disease. (Is that low?)
The fundamental belief offered in this lesson is officially called the Law of Large Numbers. If explored and used at the very beginning of a probability course and coupled with the area model (drawing a subdivided rectangle with areas in proportion to the percentage of times one expects outcomes), it makes for a powerful and easy student entry into probability thinking and calculating.
This is the approach we’ll take in the lessons that follow.


Resources
Books
Take your understanding to the next level with easy to understand books by James Tanton.
BROWSE BOOKS![]()
Guides & Solutions
Dive deeper into key topics through detailed, easy to follow guides and solution sets.
BROWSE GUIDES![]()
Donations
Consider supporting G'Day Math! with a donation, of any amount.
Your support is so much appreciated and enables the continued creation of great course content. Thanks!
Ready to Help?
Donations can be made via PayPal and major credit cards. A PayPal account is not required. Many thanks!
DONATE![]()