The Astounding Power of Area
4.7 EXTRA: Pushing Infinite Examples Further – Part 1
<UNDER CONSTRUCTION>
Consider again the infinite garden path system of lesson 4.4.
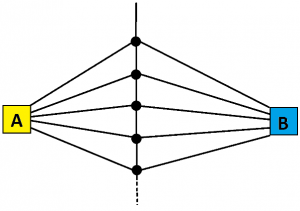 Folk going down this system first encounter a three-way folk. Those who go left head to the yellow house A, those who go right to the blue house B, and those who go straight repeat this process with another three-way fork, and so on, ad infinitum. We have to assume that there are an infinitude of people walking through this infinite system. (We’re certainly playing a game of the mind.)
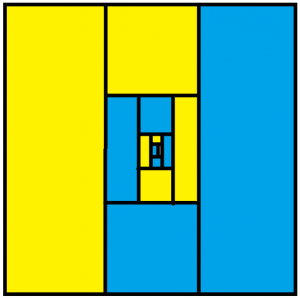
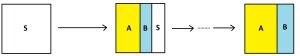
We were led to the following area-model diagram showing that, at the end of time, half the people sent down this system end up in house A and half end up in house B.
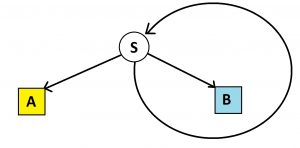
In this example we kept sending a subset of people at each fork to an identical fork with same infinite structure below it. It is though we sent them back to start.
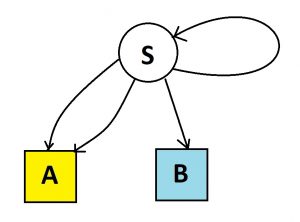
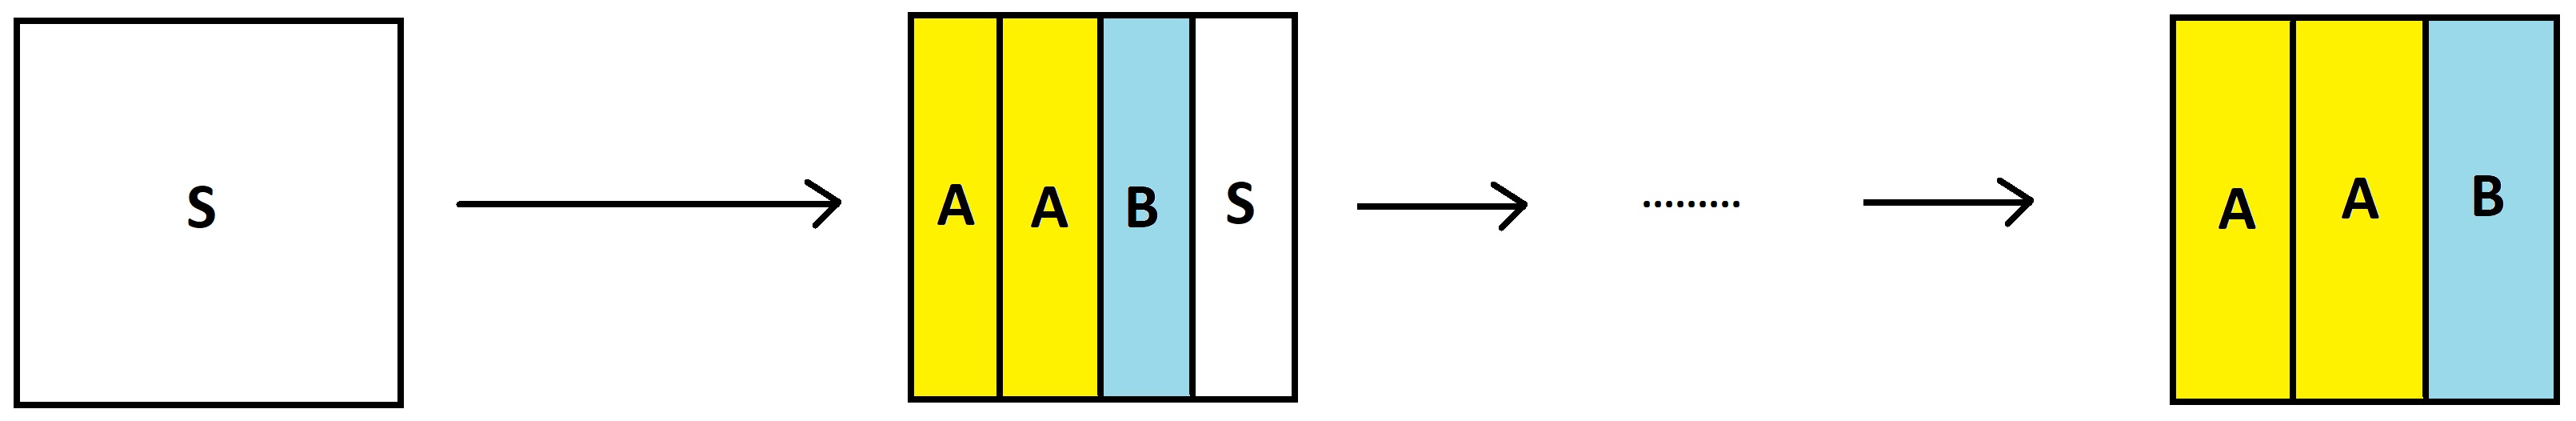
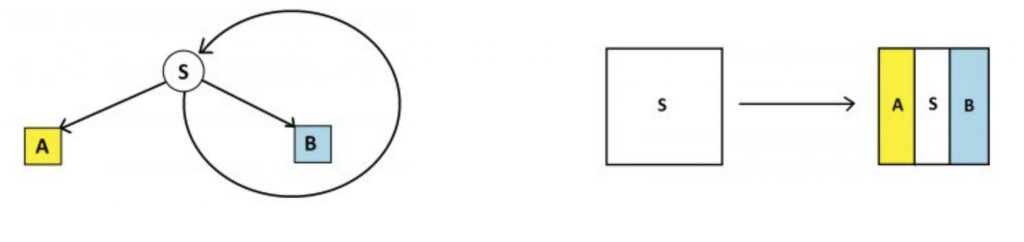
In fact we can simplify our garden path diagram by doing exactly that: designating a starting location for people, S, drawing just a single three-way fork at that start location, with people heading left going to house A, people heading right to house B, and the people heading straight returning to start to repeat the entire process.
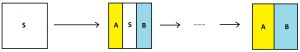
Initially we have an inconceivably large number of people in the starting node. After one run through the system, one third of those folk end up in house A, one third in house B, and one third back at start. After a next run through through the system, those in start split into thirds again. And so on We see we are generating the same infinite spiral picture leading to the same conclusion that, at the end of time, half the people in the system will end up in house A and half in house B.
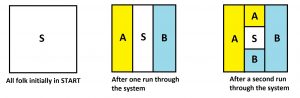
But we could have concluded this with the picture arising from just one run-through of the system!
Notice we are repeatedly performing a fixed iteration: any region labeled S is replaced by two sections labeled A and B, equal in area, and another section S. 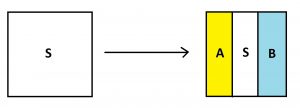
As we do this over and over again the region labeled S will diminish to zero area and we will be left with sections of equal area labeled A and B. That is, at the end of time we simply must be left with half the picture labeled A and half labeled B.
To double-check this reasoning, let’s look at a slightly more complicated system.
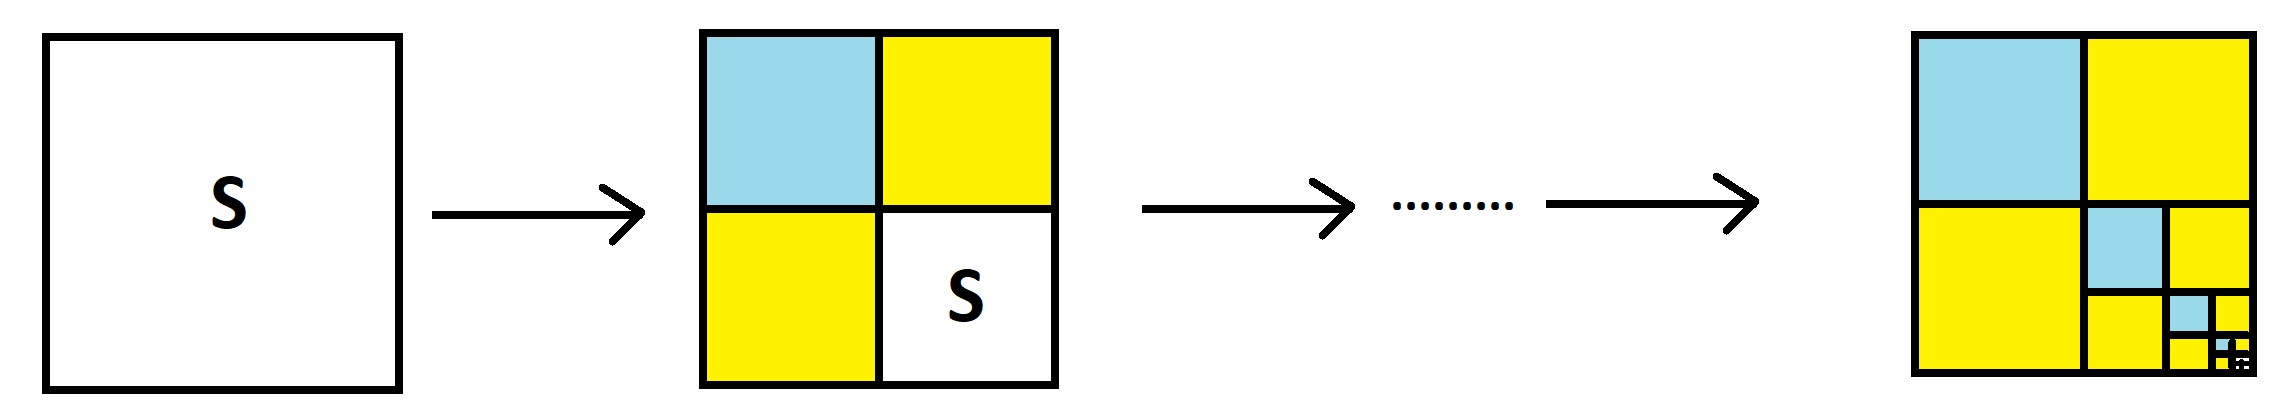
This corresponds to a garden path system with an infinite number of four-way forks each with two paths leading to house A, one to house B, and the fourth to another four-way fork of the same type. Starting with an inconceivably large number of people in S we see the iteration pattern:
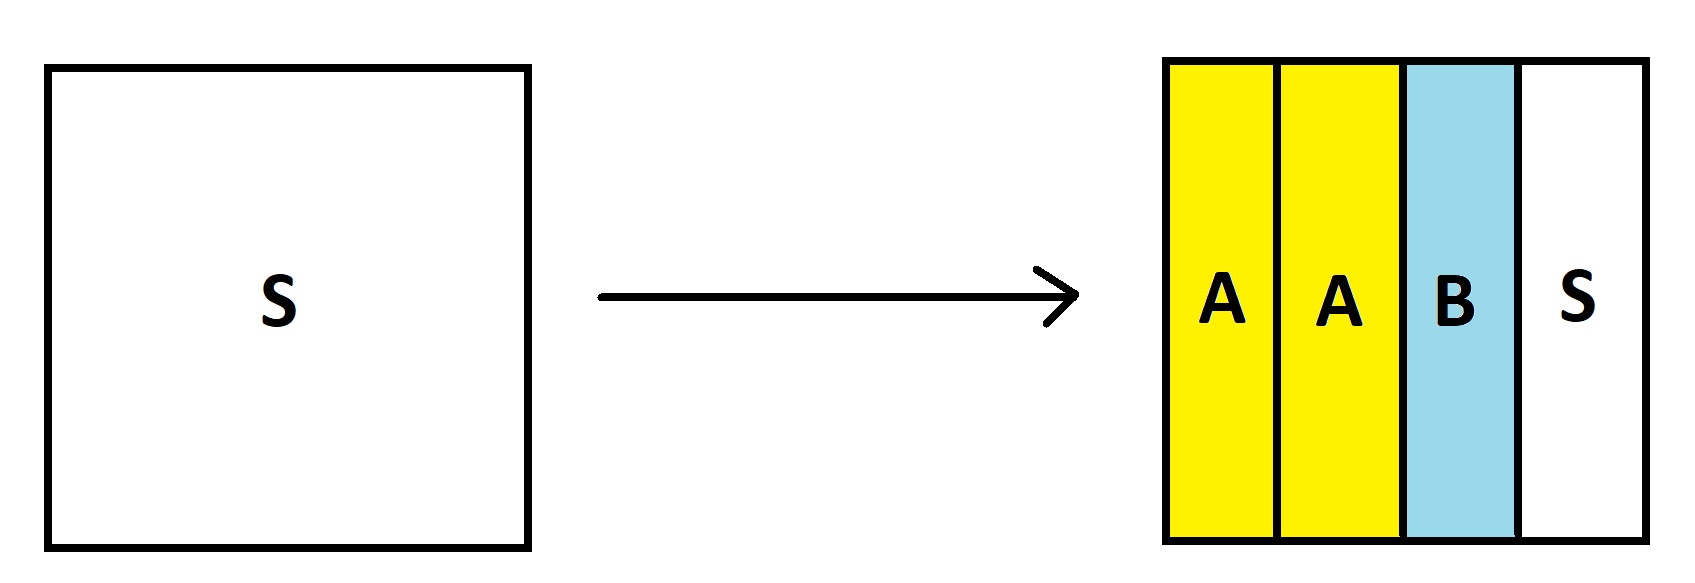
As we repeat this iteration, any region S is replaced with a smaller region S (diminishing to zero area) surrounded by two-thirds of area labeled A and one-third of area labeled B. As this is repeated indefinitely for all time, we must up with a full square with two-thirds of its area labeled A and one-third B.
Here is a prettier way to see this.
We’re developing a general principle:
If a picture of a region S is replaced with a picture of that region divided into subregions of certain areas, one labeled S and others with different labels with areas in a certain ratio, then indefinitely iterating the process of redrawing any region labeled S with labeled subregions with areas in the same ratio creates a fully filled version of the original figure. The areas of the labeled regions in the final result matches the ratios of those areas in the first iteration.
For example, in this iteration picture, half the area outside of subregions S are yellow, and one quarter is purple, and one quarter is blue (assuming the little rectangles I am attempting to draw are of equal size).
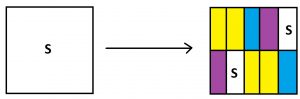
When we perform this iteration indefinitely, the final result will be a fully-colored square with half its area yellow, one quarter purple, and one quarter blue
Weighted Edges
In our second example we drew two paths from start to house A, one to house B, and one back to start. Rather than draw parallel edges, we could draw single edges and label them with “weights” indicating what proportion of who people will follow each given path.
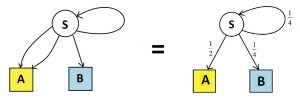
We can draw regions of areas \(\dfrac{1}{2}\) and \(\dfrac{1}{4}\) directly in our iteration diagram, and see the \(2:1\) ratio of areas in that first diagram to hence yield the same ratio of areas in the final diagram.
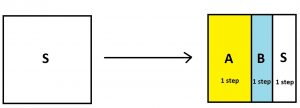
Expected Number of Steps
In this example – with half the people moving straight to house A, one quarter straight to house B, and a quarter of the people repeating this procedure–what is the average number of steps each person took to end up in a house? Some people took 1 step (three-quarters of them), some took 2 steps to get to a house, some took 17 steps. What is the average number?
One way to get at this average number of steps is to give its value a name. Most people choose the letter \(m\) here for the mean number of steps.
For all the people in the picture in the left, standing in start, they will each take, on average, \(m\) steps to end up in a house.
Now have them all take one step and so distribute themselves according to the picture on the right. Let’s look at their average count of steps from having taken note of their first steps.
We see then \(\dfrac{3}{4}\) of the people will stop after this one step and \(\dfrac{1}{4}\) of the people will be left to keep going from start again and so will take, on average, another \(m\) steps to end up in a house. That is, three-quarters of the people will stop after \(1\) step and one-quarter of the people will conduct a total of \(1+m\) steps, on average. So the average count of steps is also given by
\(\dfrac{3}{4}(1)+ \dfrac{1}{4}\left(1+m\right)\).
So have the equation \(m=\dfrac{3}{4}(1)+ \dfrac{1}{4}\left(1+m\right)\) giving
\(4m=3+\left(1+m\right)\)
\(3m=4\)
\(m=\dfrac{4}{3}\)
The average number of steps people take to end up in a house is one-and-a-third.
Here’s our first example.
Suppose, on average, each person takes \(m\) steps to end up in a house. The left and right squares show that
\(m=\dfrac{1}{3}\left(1\right) +\dfrac{1}{3}\left(1+m\right)+\dfrac{1}{3}\left(1\right) \)
giving
\(3m=1+1+m+1\)
\(m=\dfrac{3}{2}\).
Question: Does it make sense that the average number of steps folk take to end up in a house here is larger?
A Complicated Example
Consider this strange abstract example. (We’ll do some more concrete examples in the next section.)
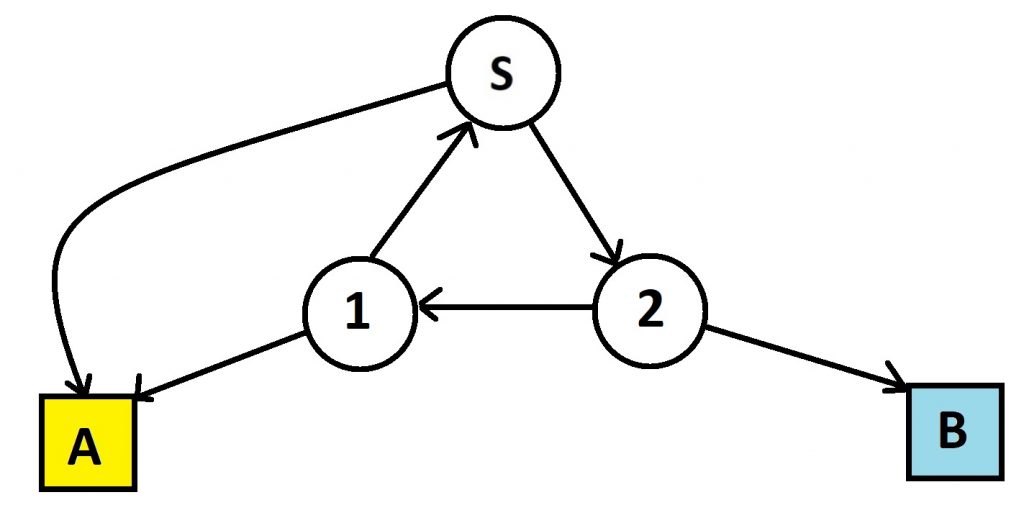
Here an inconceivably large number of people start in start node S. Half will move to house A right away and half will move to a node labeled 2. (We should label the edges with weights \(\frac{1}{2}\). When edges aren’t labeled, let’s follow the standard convention and assume outgoing edges are equally weighted.) Of those in node 2, half will move to house B and half will move to node 1. Of those in node 1, half will move to house A and half will go back to start to repeat the process.
Here are our two questions:
What proportion of people end up in each house after infinite play of this complex path system?
What is the average count of steps each people take to end up in a house?
Let’s just draw a rectangle to represent the system, but also keep count of the steps taken along the way.
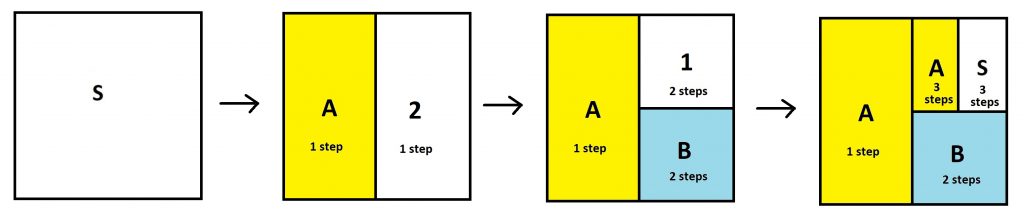
Let’s stop here as we’ve now reached a diagram fully labeled with regions A and B and a subregion S. In fact, we see that \(\dfrac{5}{7}\) of the region outside of S is labeled A (five of the seven eighths outside of S) and \(\dfrac{2}{7}\) is labelled B (two of the seven eighths outside of S). Thus if we iterate these steps indefinitely we will see the whole square painted yellow and blue, with \(\dfrac{5}{7}\) of the region painted yellow for house A, \(\dfrac{2}{7}\) painted blue for house B. These are the proportions of people that end up in each house.
Let \(m\) be the average count of steps people take to end up in a house.
The squares on the left and right show that
\(m=\dfrac{1}{2}\left(1\right) + \dfrac{1}{4}\left(2\right) + \dfrac{1}{8}\left(3\right) + \dfrac{1}{8}\left(3+m\right) \) .
Solving gives
\(m=\dfrac{12}{7}\).
Aside on Jargon
A diagram with nodes, edges, and houses represents what is called an absorbing Markov chain. One imagines an individual roaming about the diagram, starting at one node (which we’ve been calling S) and choosing edges to follow with probability given by their assigned weights or with equal probability if no weights are explicitly assigned. As soon as that person finds herself in a house, the game stops as there is no path out of a house. (A house is an absorbing state.) In this lesson we’ve been examining the probabilistic motion of a single person roaming about a diagram by imagining the average behavior of an inconceivable large number of people moving through the system. The proportion of people we compute who end up in a particular house matches the probability of an individual roaming about the diagram ending up in that house, and the value \(m\) we compute is the average number of steps we expect an individual to make before ending up in some absorbing state.


Resources
Books
Take your understanding to the next level with easy to understand books by James Tanton.
BROWSE BOOKS![]()
Guides & Solutions
Dive deeper into key topics through detailed, easy to follow guides and solution sets.
BROWSE GUIDES![]()
Donations
Consider supporting G'Day Math! with a donation, of any amount.
Your support is so much appreciated and enables the continued creation of great course content. Thanks!
Ready to Help?
Donations can be made via PayPal and major credit cards. A PayPal account is not required. Many thanks!
DONATE![]()