The Astounding Power of Area
4.8 EXTRA: Pushing Infinite Examples Further – Part 2
<Under Construction>
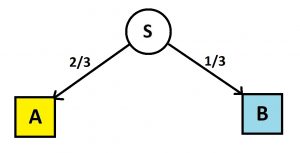
Here’s an infinite garden path with two types of two-way forks: each fork sends half the folk to one house and the other half to the other type of fork.
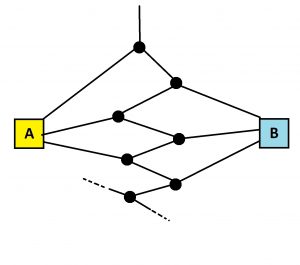
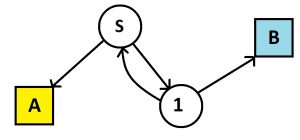
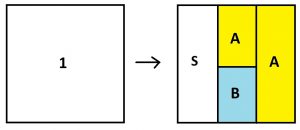
We have a start node, which we’ll call S, which sends folk to house A and to the second node, which we’ll call 1. This second node sends folk to house B and to another node identical to S. Thus this infinite garden path system can be more succinctly drawn as follows.
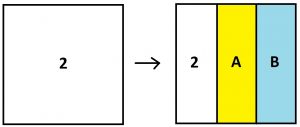
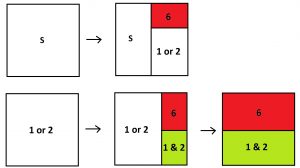
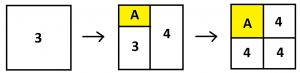
Here’s the iteration process we have represented via areas.
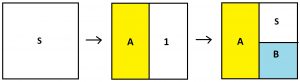
Upon repeated iteration we see that the square is going to fill up with two-thirds of the area yellow labeled A and one-third of the area blue labeled B. Thus two-thirds of the folk heading down the infinite garden path system will end up in house A and the one-third in house B.
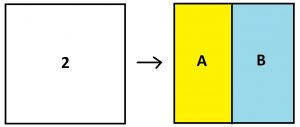
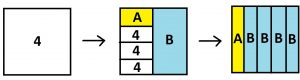
If we like we can now say that our iteration process is “equivalent in distribution” to a one-step picture
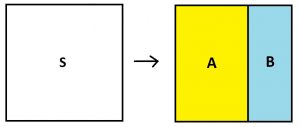
and our system of nodes and paths is “equivalent in distribution” to a much simpler system.
WARNING: We are now ignoring the average number of steps people take to reach a house. Clearly in the simpler picture of a start node and an edge directly to each house, each and every person takes exactly one step to reach a house. But in the original diagram folk take an average of \(\dfrac{5}{3}\) steps to reach a house. (Check this.) But in both systems, the same two-thirds/one-third proportions of people end up in each house. In all that follows we’ll assume we only care about the proportion of people that end up in each house.
A Complicated Example
Consider this tangled system of nodes and edges and three houses.
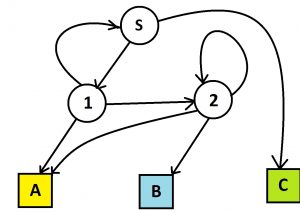
W have following iteration picture for S.
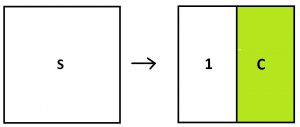 It involves node 1 which has this iteration picture.
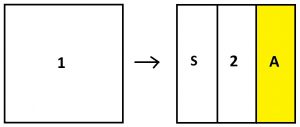
And this involves node 2 which has this iteration picture.
We can work this third diagram as it refers only to itself! (Let’s say that it is “purely self-referential.”) We see it is equivalent to
So of all the people that end up in node 2, half will go to house A and half will go to house B. We can use this observation to rewrite the iteration process for node 1.
So of all the people that ever end up in node 1, a third will go back to start, one half will go to house A, and one sixth to house B. We can use this observation to rewrite the iteration process for the start node.
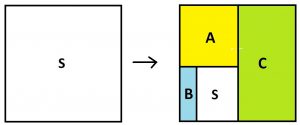
This is now refers only to itself! (Again, its purely self-referential.) If we imagine the whole square divided into twelfths, we see that area A occupies 3 twelfths of the square, B just 1 twelfth, and C fills 6 twelfths. A total of ten twelfths are colored. So A covers \(\dfrac{3}{10}\) of the colored area, B covers \(\dfrac{1}{10}\), and covers \(\dfrac{6}{10}\). These are the proportions of the whole square that will be covered by each color after repeated iteration, and so we see
30% of people end up in house A
10% of people in house B
60% of people in house C.
(Phew! That was complicated.)
A Simpler Coin-Toss Question
I will repeatedly toss a coin. What are the chances I’ll see two heads tossed in a row (HH) before I’ll see a head immediately followed by a tail (HT)?
We can answer this question by pure thought:
If I first toss one tail, or two tails, or a string of tails of any length, we’re no closer to seeing either HH or HT. The experiment doesn’t “kick in” until I see my first head. Once I do, there is a 50% chance that the toss after that will also land heads (to see HH) and a 50% it will land tail (to see HT). Thus there is a 50% chance I will see HH before seeing HT.
But let’s answer this question by drawing a diagram of nodes, edges, and houses.
To do this, imagine an inconceivably large number each about to repeatedly toss a coin. They all begin in a start state of “about to toss their coin for the first time.” We’ll label this state S.
On a first toss, some will toss a head right away–half of them in an ideal world–and be set for seeing either HH or HT. The other half will toss a tail, which is irrelevant to the outcome desired. We may as well just send those folk back to the start state and have them try again.
Of those who first toss a head, half (in an ideal world) will next toss a head to see HH and half a tail to see HT.
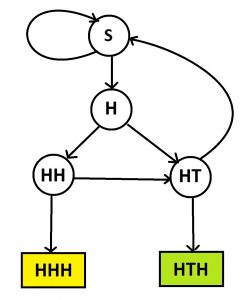
Thus the entire set of experiences of all these people tossing coins corresponds a system that looks like this.
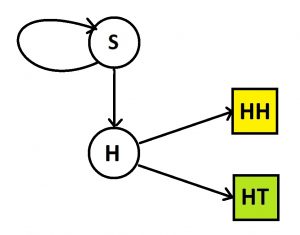
We see
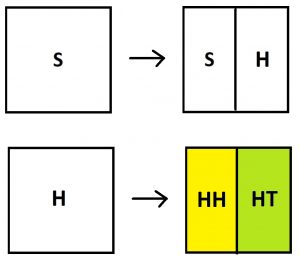
The iteration diagram for H is not self-referential: for any group in state H, half will go to HH and half will got to HT. So let’s “substitute” this fact from the second diagram into the first to get
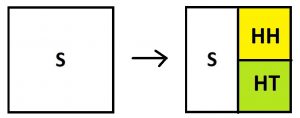
This is purely self-referential. If we iterate repeatedly we see that that the entire square will fill with color with half the area yellow matching the state HH and half green matching the state HT. Thus half of the inconceivably large count of people running this coin-tossing experiment will see HH. This the probability we seek is indeed 50%.
A Die-Roll Question
I will repeatedly roll a die. What are the chances that I will see both the roll of a 1 and the roll of a 2 sometime before I see a roll of 6?
To answer this question imagine an inconceivably large number of people about to each roll a die repeatedly. When folk get going, some will see both the roll of a 1 and a 2 before seeing a 6. Others won’t. We want to know the proportion of people that do.
Everyone is at “start” state – about to start their rolls.
Some will roll a 6 right away–one-sixth of them an ideal world–and will be immediately ruled out.
Some will roll a 3, 4, or 5–one half of them in an ideal world. As none of these numbers is relevant to what we are examining they will roll again, as though they are starting from the beginning of the experiment.
Some will roll a 1 or a 2 right away–one third of them in an ideal world–and will still be “in the game.”
Of those in the last group …
Some will roll a 6 next–one sixth of them in an ideal world–and will be ruled out.
Some will roll a 3, 4, 5–one half of them in an ideal word–which would be considered an irrelevant roll and will remain in the same predicament. So too will those rolling a repeat 1 or a repeat 2. This will happen, in an ideal world, for one sixth of the people. In total, \(\dfrac{1}{2}+\dfrac{1}{6}=\dfrac{2}{3}\) of these people will have an irrelevant roll and be back in the same state.
The remaining folk–one sixth of them in an ideal world–will get what they are looking for: a 1 if they earlier rolled a 2, or a 2 if they earlier rolled a 1.
We’ve just described the following diagram of nodes, edges, and houses.
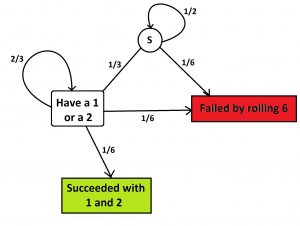
We see
The diagram for the “1 or 2” node refers only to itself, it is purely self-referential, and we see it is equivalent to a square equally red and green: half the folk with a 1 or 2 in hand will “win” the game and half will lose. Thus we can redraw the iteration picture for the start state as
This too is purely self-referential. As this picture is repeatedly iterated, we see that one-third of the people playing this game will be successful in rolling both a 1 and 2 before following a 6. This the probability we seek is thus \(\dfrac{1}{3}\).
EXERCISE: I will repeatedly roll a die. What are the chances that I will see either the roll of a 1 or the roll of a 2 sometime before seeing a roll of 6?
A General Process
If we have a complicated system of nodes and houses, we can draw an iteration area diagram for each node.
If one such diagram refers only to itself and the houses (it’s purely self-referential), then we can replace it with a completely filled diagram. This simplifies the picture.
If one diagram does not refer to itself at all, then we can use it “eliminate a variable” in the other diagrams by copying the areas it suggests in each subregion.
With luck, we can keep “simplifying” our chain of diagrams until all refer only to houses. Then we can read off the proportion of people that appear in each house.
Question: Is luck needed? Is this approach sure to always lead to solutions? Can something go wrong? (See the final example of this section to see that we don’t need iteration diagrams to be purely self-referential.)
A Complicated Coin-Tossing Question
I will repeatedly toss a coin. What are the chances I’ll see three consecutive heads (HHH) before I’ll see a head-tail-head triple (HTH)?
Here’s the nodes, edges, and houses diagram for this question. (Did I get it right?)
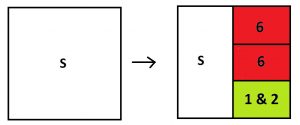
We have the iteration diagrams:
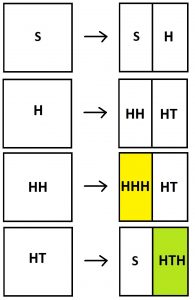
We can “back substitute” in this series of diagrams: use the fourth diagram to redraw the third, and use the third and fourth to redraw the second, and use that to redraw this first.
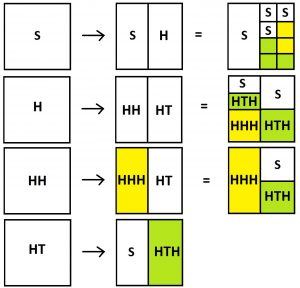
The diagram for the start node S is now purely self-referential. We see, upon repeated iteration, it will fill up two-fifths yellow and three-fifths green. Thus, for an inconceivably large number of people each performing this coin toss experiment, two-fifths of them will see HHH first. The probability we seek is thus \(\dfrac{2}{5}\).
A Random Walk
Allistaire is at one one of the positions labeled 1, 2, 3, or 4 and, at each location, has a 50% chance of stepping left or stepping right. (He chooses which direction to go with the flip of a coin.) What are the chances Allistaire will land in house A from each possible starting position?
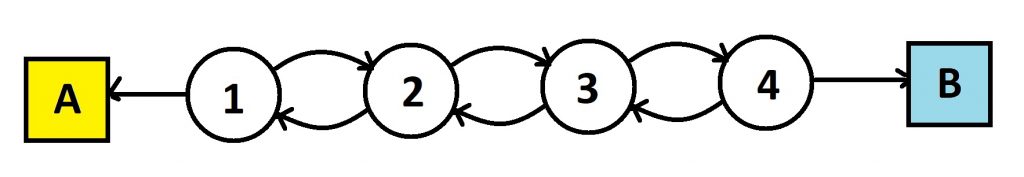
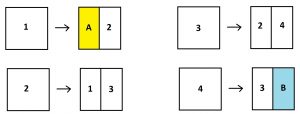
We have the following iteration diagrams.
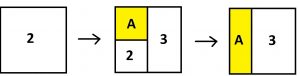
Substituting the picture for 1 into the picture for 2 gives a self-referential picture for 2. It is not purely self-referential (it refers to node 3 as well) but we can nonetheless see that upon repeated iteration one third of people end up in house A and two-thirds go to 3 when coming from node 2.
Substituting this into the picture for 3 gives a self-referential picture there. Upon repeated iteration we have a square that is one-quarter A and three-quarters B.
Substituting into the picture for 4 and repeatedly iterating gives
We now see that, from node 4, Allistaire ends up in house A one-fifth of the time.
This means in the picture for node 3, the fraction of area taken by yellow region A is \(\dfrac{1}{4}+\dfrac{1}{5}\times \dfrac{3}{4}=\dfrac{2}{5}\). From 3, Allistaire ends up in house A two-fifths of the time.
This means in the picture for node 2, the fraction of area taken by yellow region A is \(\dfrac{1}{3}+\dfrac{2}{5}\times \dfrac{2}{3}=\dfrac{3}{5}\). From 2, Allistaire ends up in house A three-fifths of the time.
This means in the picture for node 1, the fraction of area taken by yellow region A is \(\dfrac{1}{2}+\dfrac{3}{5}\times \dfrac{1}{2}=\dfrac{4}{5}\). From 1, Allistaire ends up in house A four-fifths of the time.


Resources
Books
Take your understanding to the next level with easy to understand books by James Tanton.
BROWSE BOOKS![]()
Guides & Solutions
Dive deeper into key topics through detailed, easy to follow guides and solution sets.
BROWSE GUIDES![]()
Donations
Consider supporting G'Day Math! with a donation, of any amount.
Your support is so much appreciated and enables the continued creation of great course content. Thanks!
Ready to Help?
Donations can be made via PayPal and major credit cards. A PayPal account is not required. Many thanks!
DONATE![]()