Global Math Project Experiences
2.5 PROBABILITY: What we Choose to Believe (PART II)
Lesson materials located below the video overview.
We say that in flipping a coin a large number of times we expect about half the tosses to land HEADS and about half to land TAILS. But what are we really saying here? What intuitive belief is underlying such a statement?
Similarly, when we say that there is a two-sixths chance of seeing a 1 or a 3 when rolling a die, what do we really mean by “chance”?
These questions, albeit vague, are valid questions. We know, for example, that when we actually do toss a coin a number of times it is rare to actually see exactly half the tosses HEADS and half TAILS. So, there is something subtle afoot here.
| Try this: (Read through all these instructions first to see what is coming!)
Flip a coin ten times in a row. Did you actually see five heads and five tails? Flip a coin another ten times in a row. Did you see five heads and five tails this time? Do this a third time. Did you see five heads and five tails? Among all 30 flips you just conducted, were you close to seeing 15 heads and 15 tails? As a percentage, what proportion of the 30 tosses were heads? Suppose you and friend each conducted this exercise. Among your 60 flips, were you close to seeing 30 heads and 30 tails? As a percentage, what proportion of the 60 tosses were heads? Suppose you are in a classroom of many students, say 20, and you each flipped a coin 30 times. What percentage of the 600 tosses were heads? (Now that you’ve read these instructions and haven’t yet done the activity, think for a moment about what percentages you might expect and the accuracy of your guesses. Now you are ready to do this exercise!) |
Our Basic Belief of what Chance Means
The activity above illustrates our basic belief about random events.
We intuitively believe that for many basic actions, such as flipping a coin, rolling a die, spinning a spinner, and so on, each possible outcome from the action has a certain inherent number associated with it, called its probability, and this number manifests itself as follows.
If an outcome of an action has a probability p% of occurring, then that means in performing that action many, many times we expect to see that particular outcome about p% of the time. (And this observed proportion gets closer and closer to being exactly p% if we perform the action more and more times.)
For example, in flipping a coin and looking to see a HEAD, we associate the number 50%. This is because if we flip a coin 90,000 times, say, we feel we’d see about 45,000 of those tosses landing heads. And the percentage of heads seen will likely be closer to exactly 50% if we tossed the coin 900,000 or 9,000,000 times.
If we roll a die one million times, we feel we’ll likely see a roll of a 6 close to one-sixth of the time.
We also feel that this intuitive idea works in reverse. For example, if we toss a coin 500 times and it lands heads for a count of 403 of those 500 tosses, then we’ll all strongly suspect that the coin is biased (and biased with a probability of about 80% for landing heads).
This intuitive feeling for what probability means is enough to allow us to work our way up to some very challenging problems. We’ll take it slowly.
Notation: People usually use the letter \(P\) to denote a probability value. For example, in flipping a fair coin we might write \(P\left(HEAD\right)=\dfrac{1}{2}=50\%\) and in rolling a fair die, \(P\left(seeing \> a \>SIX\right)=\dfrac{1}{6}\).
Example: Imagine rolling a die and then flipping a coin. What are the chances of seeing a 6 followed by a HEAD?
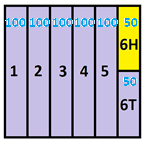
Answer: Imagine running this double-barreled experiment a large number of times, say, 600 times. (That is roll a die and then toss a coin and record the pair of results six hundred times.) Then we would expect to see a roll of a 6 about 100 times. And of those 100 rolls, we expect half to be followed by a toss of HEADS and half followed by a toss of TAILS. So we expect 50 of our 600 runs of the experiment to have the desired result.
Thus we conclude \(P\left(6 \> and \> HEAD\right)=\dfrac{50}{600}=\dfrac{1}{12}\).
This picture of a rectangle records these expected counts.
A Complex Example:
A bag contains 8 Tuscan sunset orange balls and 2 Tahitian sunrise orange balls. The color difference is very subtle and only 70% of people can correctly identify the color of the ball when handed one of either color. Lulu pulls a ball out of the bag at random and tells you over the phone that she pulled out a Tahitian sunrise ball. What are the chances that the ball she holds in her hand really is Tahitian sunrise?
Answer: Let’s assume, as the given statistic suggests, that there is a 70% chance that Lulu correctly identifies the color of a ball when handed one.
Now imagine Lulu conducting this ball-picking experiment a large number of times, say 1000 times (and that even with this practice her chances of correctly identifying colors does not change).
About 800 of the balls Lulu pulls out will be Tuscan sunset. Of those she will identify about \(0.7 \times 800 = 560\) correctly as Tuscan sunset and 240 she will incorrectly say are Tahitian sunrise.
About 200 of the balls Lulu pulls out will be Tahitian sunrise, of which she will correctly identify \(0.7\times 200-140\) as such. However, she will incorrectly call 60 of them Tuscan sunset.
This rectangle illustrates these numbers.
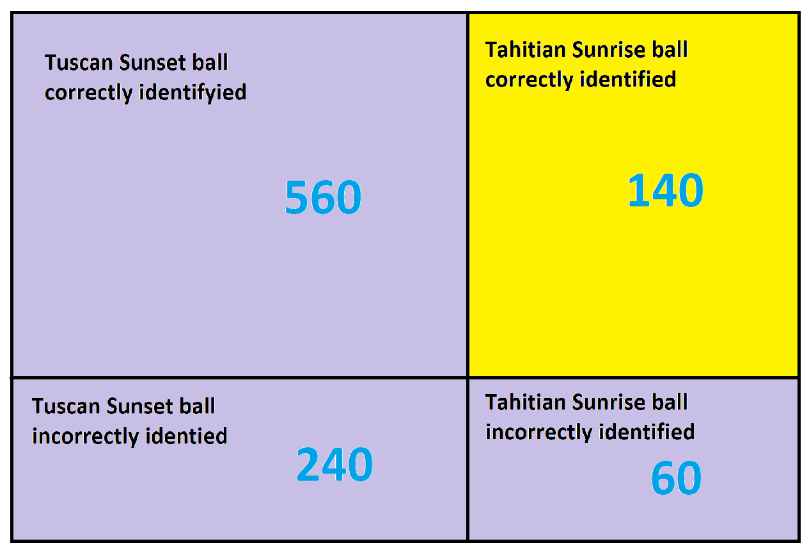
Thus in these 1000 runs of the exercise we see that Lulu will say “Tahitian sunrise” about \(240+140=380\) times and will be correct in saying this \(140\) of those times. This shows that the probability that the ball she holds really is Tahitian sunrise is \(\dfrac{140}{380}\approx 37\%\). Pretty low!
Comment: This is why eye-witness testimony in court cases is usually taken with skepticism. Even if an eye-witness can be shown to be correct in identifying a certain phenomenon the majority of times, it might still be the case that the eye witness is incorrect the majority of the times!
Practice 1: Suppose that 1% of the population has a certain disease. A test for the disease has been developed. This test will return a correct positive result for 99% of the people who actually have the disease (meaning that there is a 1% chance of a “false negative”) and a correct negative result for 95% of the people who do not have the disease (meaning that there is a 5% chance it will produce a “false positive”).
You have just been tested positive for the disease! Show that there is one a one-in-six chance that you actually have the disease.
PEDAGOGICAL COMMENT: The fundamental belief offered in this lesson is officially called The Law of Large Numbers. If explored and used at the very beginning of a formal probability course and coupled with the area model (drawing a rectangle and subdividing into regions area in proportion of times one expects to see each outcome) it makes for a powerful and intuitive entry into probability thinking and calculating. Coupling this with garden-paths throughout the discussions adds to the intuition development—and fun!
Resources
Books
Take your understanding to the next level with easy to understand books by James Tanton.
BROWSE BOOKS![]()
Guides & Solutions
Dive deeper into key topics through detailed, easy to follow guides and solution sets.
BROWSE GUIDES![]()
Donations
Consider supporting G'Day Math! with a donation, of any amount.
Your support is so much appreciated and enables the continued creation of great course content. Thanks!
Ready to Help?
Donations can be made via PayPal and major credit cards. A PayPal account is not required. Many thanks!
DONATE![]()